Football Team Performance
Facilitating deeper football analysis, smarter player recruitment
For close to two decades, Opta data has been powering football’s data revolution – changing the way coaches, analysts and players see the game.
Now our Opta Vision data, integrated into analysis software, is unlocking new ways of evaluating performance: helping men’s and women’s teams gain a competitive edge on the field and further expand recruitment profiling of players.
Talk to an expertTrusted by leading Teams, Leagues and Federations


Introducing our most advanced data for football: Opta Vision
Opta Vision captures dynamic XY field locations for all 22 players in the match, uninterrupted, from the kick-off to the final whistle – totalling over 2 million individual data points per game.
Request a demo
Raw Data Feeds
Uninterrupted player trajectory data for every player on the pitch, fully synchronised to on-ball events, from over 80 of the biggest global leagues and competitions.
AI-Enriched Metrics
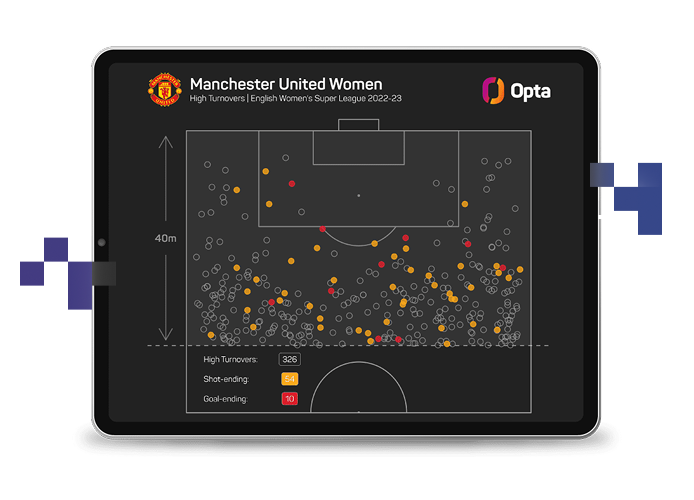
Identify new and actionable insights into underlying player performance, including on-ball player decision making, off-ball player runs and changes to team shape.
Software Integrations
Review and compare player performance, on customisable dashboards, using our range of analysis and recruitment software platforms.
Equip your first-team, recruitment and academy staff with Opta-powered software solutions to drive day-to-day processes at the training ground and stadium
For the past five years, Real Betis have been using ProVision software to support performance analysis and scouting operations.
In this case study, the club’s Head of Data Analysis, Alvaro Arranz, outlines how the club is working with data to influence key decisions across different departments to improve on-field performance.
Read case study
In the analysis we carry out for the technical staff and the first team, Provision is helping us to contextualise the technical-tactical events of our team and of the rivals we play against. One of the main benefits is the reliability of the data we are supplied with, which is integrated with video. Having the video helps us validate any metric or report we create in the platform, which helps gain trust and internal buy-in.
Subscribe to our regular bulletin: The Pro Update
Everything you need to know about insights and innovation relating to performance analysis, recruitment and strategic planning
You’ll receive: news, updates, case studies and insights straight to your inbox
Start receiving the Pro Update
Let’s Talk About Helping You Achieve Your On-Field & Off-Field Objectives
Find out how our customisable software, integrated with Opta Vision, can provide your club departments with the tools to evolve existing working processes.
Speak with our team