From nine points down to WNBA champions: The data behind a historic comeback
As the Golden State Valkyries made history against the Atlanta Dream, Opta Live captured every twist and turn. From real-time win probabilities to advanced basketball insights, discover how Stats Perform is bringing a new level of data-driven storytelling to women's basketball.
A historic championship
In October 2023, Joe Lacob and Peter Guber paid a $50 million expansion fee for a WNBA franchise that didn't yet exist.
Just three years later, the Golden State Valkyries have been valued at between $850 million (Sportico) and $1 billion (CNBC), becoming one of the most remarkable commercial success stories in women's sport.
And now, in just their second season, they've made WNBA history, defeating the Atlanta Dream 68-63 in the first-ever Game 7 of the WNBA Finals.
Trailing by six points at halftime and nine midway through the third quarter, Golden State staged a remarkable comeback, inspired by Finals MVP Gabby Williams, who scored 30 points, including 28 in the second half.
But just how unlikely was their victory?
With 6:02 remaining in the third quarter, Opta Live's predictive model gave the Valkyries just a 14.6% chance of winning in regulation.
What followed was a dramatic turnaround that demonstrated not only the unpredictability of sport, but how real-time data can capture every twist and turn, bringing fans closer to the moments that define sporting history.
Find out more about Opta Live
Our commitment to parity in women's sport
At Stats Perform, we hold women’s sport to the highest standard, delivering the same rich data, sharp analysis and deep storytelling that powers the men's game.
As women's basketball reaches unprecedented heights, we are bringing true data parity to life - fueling one of the most exciting eras in hoops history with world-class innovation and predictive insights.
Because elite sport deserves elite coverage.
Talk to our team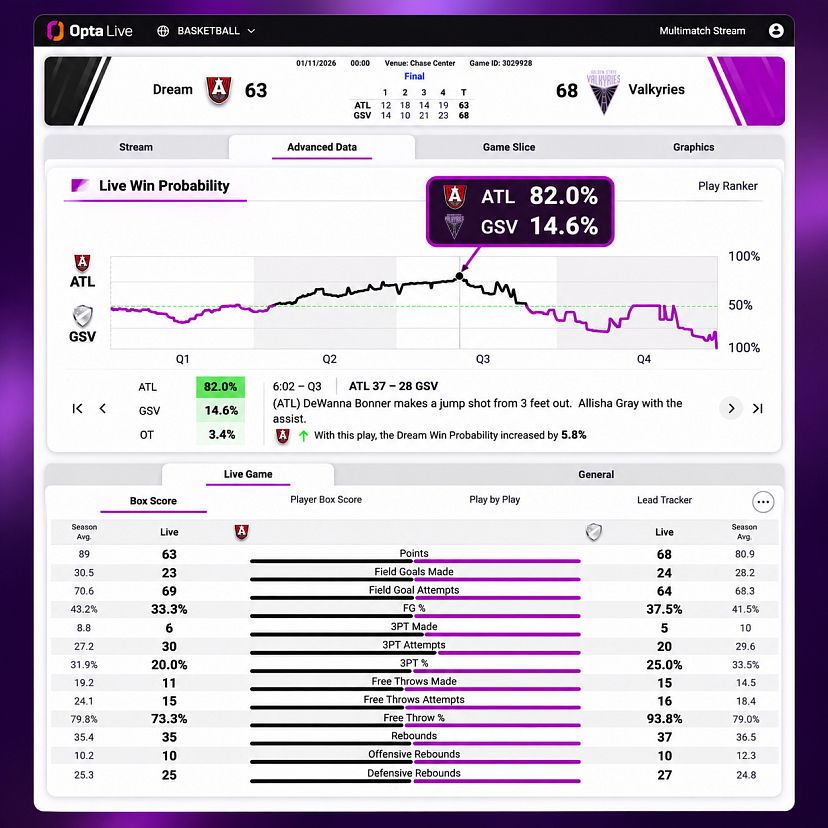
Every moment changes the game. Opta Live captures it.
A scoreboard tells us who's winning, but it doesn't tell us how likely that lead is to last, or how quickly the balance of a contest can change.
That's where Opta Live's predictive model brings another dimension to basketball storytelling.
With 6:02 remaining in the third quarter, Atlanta led 37-28. The Dream had an 82% probability of winning in regulation, while Golden State's chances stood at just 14.6%, with a further 3.4% probability of overtime.
The championship appeared to be slipping away from the Valkyries.
But as Golden State mounted their comeback, Opta Live tracked the changing probability of victory, capturing the shifts in momentum as the contest unfolded.
By combining live game data with predictive modelling, Opta Live allows broadcasters, publishers and digital platforms to put the action into context, showing not just what's happening, but what each moment means for the outcome.
And in a championship decided by five points, those changing probabilities tell a story that the final score alone never could.
Every lead, every momentum shift: bringing the game to life
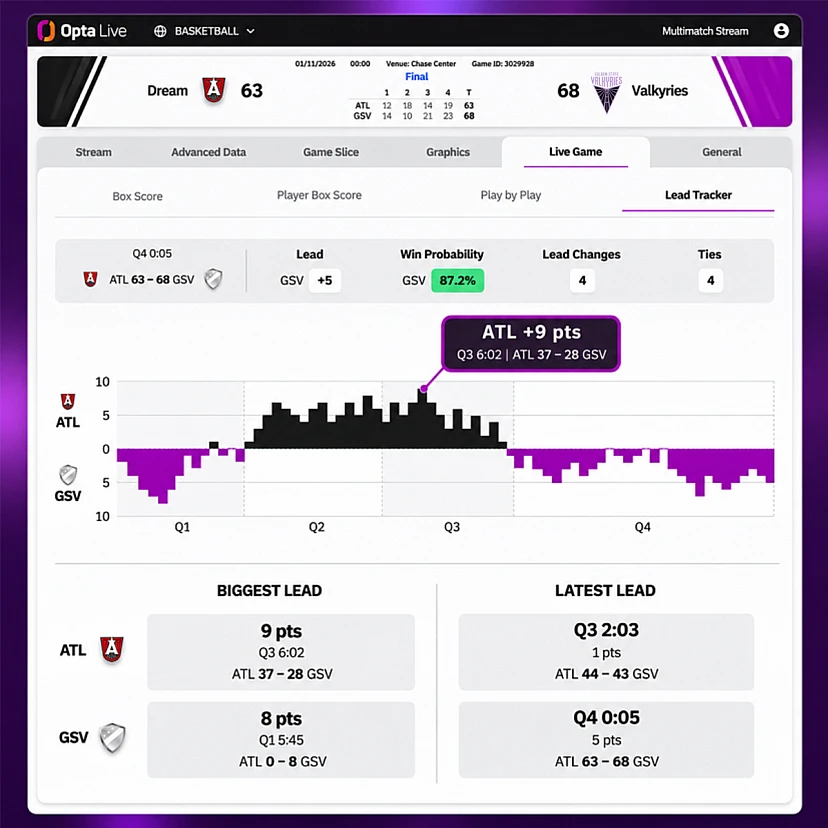
Win probability is just one way Opta Live captures the drama of a game. Its Lead Tracker offers another perspective, visualising how the balance of a contest shifts from the opening tip-off to the final buzzer.
And the WNBA Finals decider was a perfect example.
Golden State raced into an early eight-point lead, before Atlanta took control and established a nine-point advantage midway through the third quarter. But the Valkyries fought back, eventually securing a 68-63 victory in a contest featuring four lead changes and four ties.
Opta Live's Lead Tracker brings those swings to life, showing exactly when each team was in front, by how much and how the momentum changed across all four quarters.
For broadcasters and digital publishers, it's another powerful storytelling tool, transforming a traditional match timeline into an engaging visual narrative that helps fans understand how a championship was won.
Beyond the scoreboard: visualising the story of the game
Win probability reveals how a contest changes, however understanding why requires another layer of analysis.
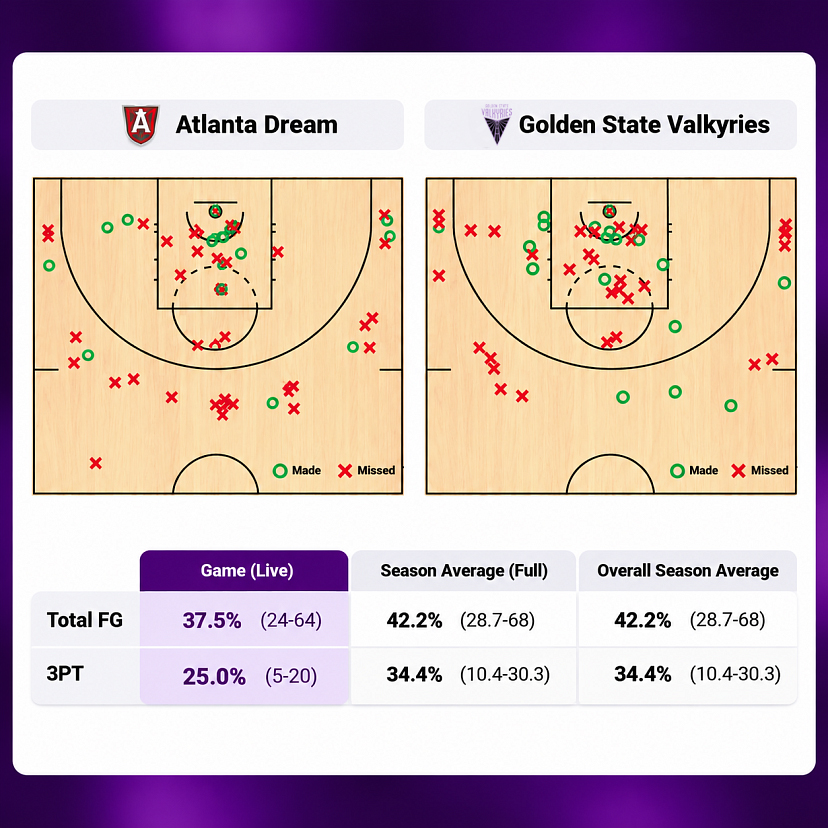
Opta Live's interactive shot charts bring the performances behind the result into focus.
Both teams struggled to find their shooting rhythm in the WNBA Finals decider. Atlanta converted just 33.3% of their field-goal attempts, compared with a season average of 44.2%, while Golden State shot 37.5%, below their usual 42.2%.
The Dream made just six of their 30 three-point attempts, while the Valkyries converted five of 20.
By plotting every made and missed shot, Opta Live reveals where teams are creating opportunities, where they're struggling and how those patterns change throughout a game.
For broadcasters, media outlets and digital publishers, these insights are available as the action unfolds. With the ability to filter by team, player or game period, they can identify emerging trends, explain key performances and bring richer, data-driven storytelling to fans in real time.
From two points to Finals MVP: the Gabby Williams story
Every championship has its defining player; for the Golden State Valkyries, that player was Gabby Williams.
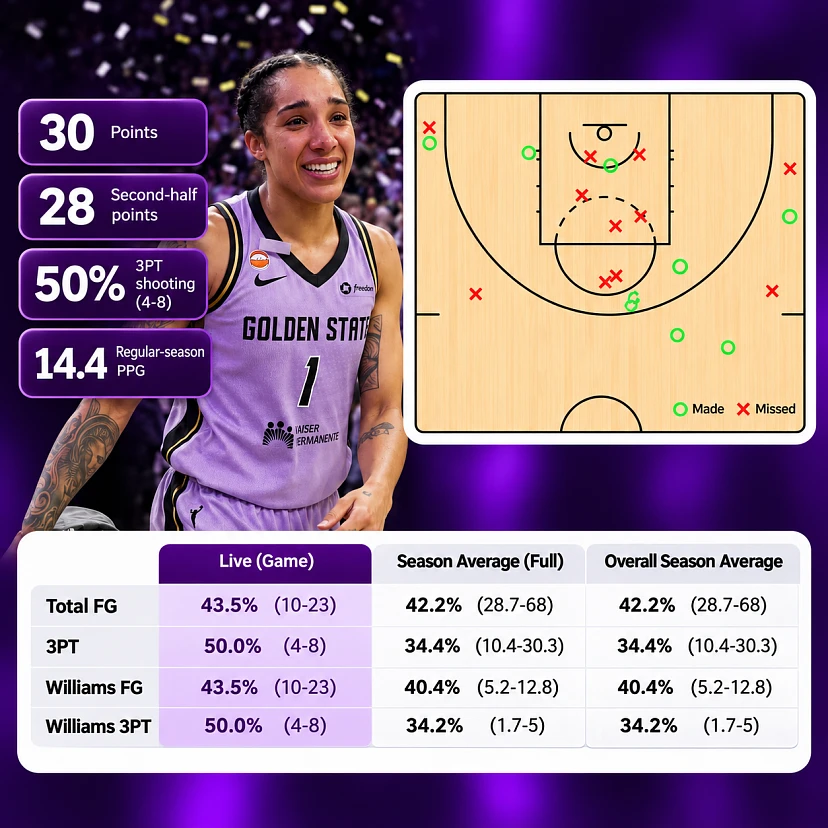
Having scored just two points in the first half, Williams exploded for 28 after the break, finishing with 30 points to inspire Golden State's remarkable comeback and claim Finals MVP honours.
It was a performance well beyond her regular-season average of 14.4 points per game. She converted 10 of her 23 field-goal attempts, including four three-pointers from eight attempts.
Opta Live brings those individual performances into focus through detailed player statistics and interactive shot charts. Broadcasters and media outlets can explore where players are making their impact, compare performances against season averages and filter the action by quarter or half.
As the drama unfolds, that depth of insight helps turn an extraordinary individual performance into a story fans can follow in real time.
Women's sport is making history, make sure you're telling its story
Women's sport is entering a new era, with bigger audiences, unforgettable performances and historic moments capturing the world's attention.
Is your platform ready to make the most of it?
From the WNBA to the biggest competitions in women's sport, Stats Perform combines trusted Opta data with world-class technology to help you create the coverage, content and experiences that turn sporting moments into lasting fan engagement.
Get in touch with the team