How we measure pressure

Of all the topics in football, the high press has one of the largest discrepancies between the interest of analysts and the ability to quantify it.
High defensive pressure has been measured before, including metrics involving opponent pass completion percentage, as viewed relative to pass difficulty or different parts of the pitch. One of the most notable existing measures of pressing is Colin Trainor’s PPDA metric. Colin has explained it in detail here, but in short, the calculation is: Opponent passes allowed per defensive action, in the opponent’s defensive 3/5ths of the pitch.
These metrics are all certainly useful ways to assess pressure and disrupting opponent possession. They are, however, somewhat one-dimensional. Pressing is tough to pin down with event metrics. It involves coordination of players one or two lines removed from the immediate action and is reliant on the movement of a team in unison. There’s also more than one way to pressure an opponent, and different teams may have different objectives in attempting to do so (focusing on harassing the player in possession or limiting passing options are two examples).
So, instead of trying to decide which single metric or model is the best for quantifying high defensive pressure, I’m advocating for a more holistic approach. By looking at more than one number for team pressure, we can let one measure illuminate the blind spots of another.
To illustrate the need for a multi-dimensional look at pressing, consider PPDA. In 2015-2016, the teams which registered the lowest PPDA (corresponding to the highest pressure) across the “Top 5” European leagues and the Eredivisie were:
| Rank | Team | League | PPDA |
| 1 | Barcelona | La Liga | 7.5 |
| 2 | Paris Saint-Germain | Ligue 1 | 7.55 |
| 3 | Lyon | Ligue 1 | 7.75 |
| 4 | Bayer 04 Leverkusen | Bundesliga | 7.82 |
| 5 | Fiorentina | Serie A | 8 |
| 6 | Celta de Vigo | La Liga | 8.13 |
| 7 | Tottenham Hotspur | Premier League | 8.2 |
| 8 | FC Bayern München | Bundesliga | 8.49 |
| 9 | Rayo Vallecano | La Liga | 8.54 |
| 10 | Lazio | Serie A | 8.82 |
Some of these teams listed above make sense. Mauricio Pochettino is famous for employing a high-pressure system at Tottenham and Pep Guardiola’s influence on Bayern Munich (and Barcelona) sticks out. But other teams might give you pause. Paris Saint Germain aren’t exactly well known for being an aggressive defensive team.
One reason for teams like PSG showing up in PPDA leaderboards might be that they dominate territory so thoroughly by possessing the ball deep in the opponent’s half that their defensive actions naturally take place higher up the pitch, even if they aren’t applying what would be considered a pressing defensive style.
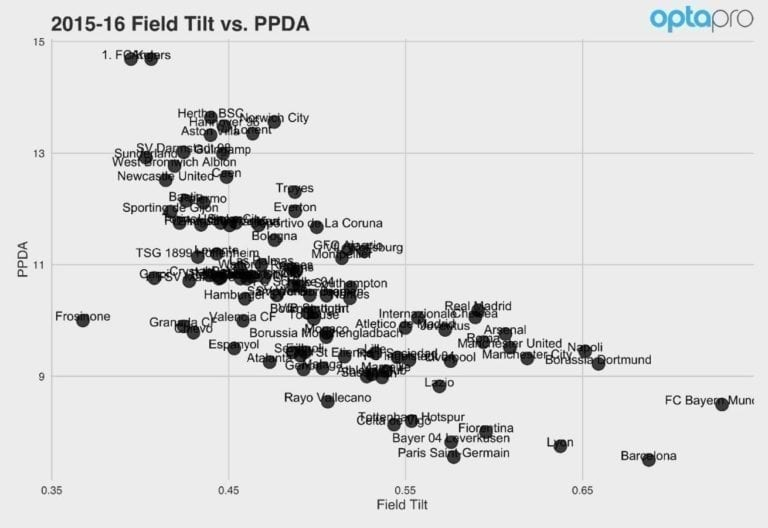
Graphing PPDA against Field Tilt (team final third passes / team and opponent final third passes) illustrates how the relationship between territorial dominance and PPDA slightly confounds the intended measurement of PPDA. It seems like some of the teams which rate highly in terms of PPDA might be making their defensive actions in a higher location up the pitch simply because that’s where most of their games take place.
(The labels that appear on the charts throughout this article are best used for identifying outliers while the majority of the data points displayed illustrate larger trends)
None of this is to say that PPDA and pass completion rate are useless or bad metrics, just that by introducing some other measures which take an alternative view of pressing we can get a clearer picture.
In light of this I tried to come up with some additional metrics which I felt captured some of the different outcomes and aims of pressing. All of the definitions below refer to actions taking place in the same region as PPDA (the attacking-most 3/5ths of the pitch from the perspective of the defending team in question).
PPDA: Defined above
Opponent Pass Completion Rate: Overall percentage of opponent passes completed.
On-ball Action Width: Distance of team non-defensive touches from the middle of the pitch.
Directness: Opponent pass distance in the x-coordinate (endline-to-endline) as a percentage of total pass length. Measures degree to which passes are progressing upfield.*
Like PPDA, some of these correlate with characteristics which we wouldn’t think of as influencing pressing, but they offer different perspectives and allow us to dig deeper into the ways teams defend higher up the pitch. They also don’t correlate especially with PPDA or pass completion percentage, meaning they’re measuring something new which wasn’t previously captured by these metrics. I also explored percentage of opponent passes which are classified as long balls or launches, but these numbers correlated closely enough with pass completion as to be less interesting on a broader scale.
Replacing field tilt on the previous graph with opponent action width we can see how two measures which relate to defensive pressure can measure different aspects or methods of this style of play.
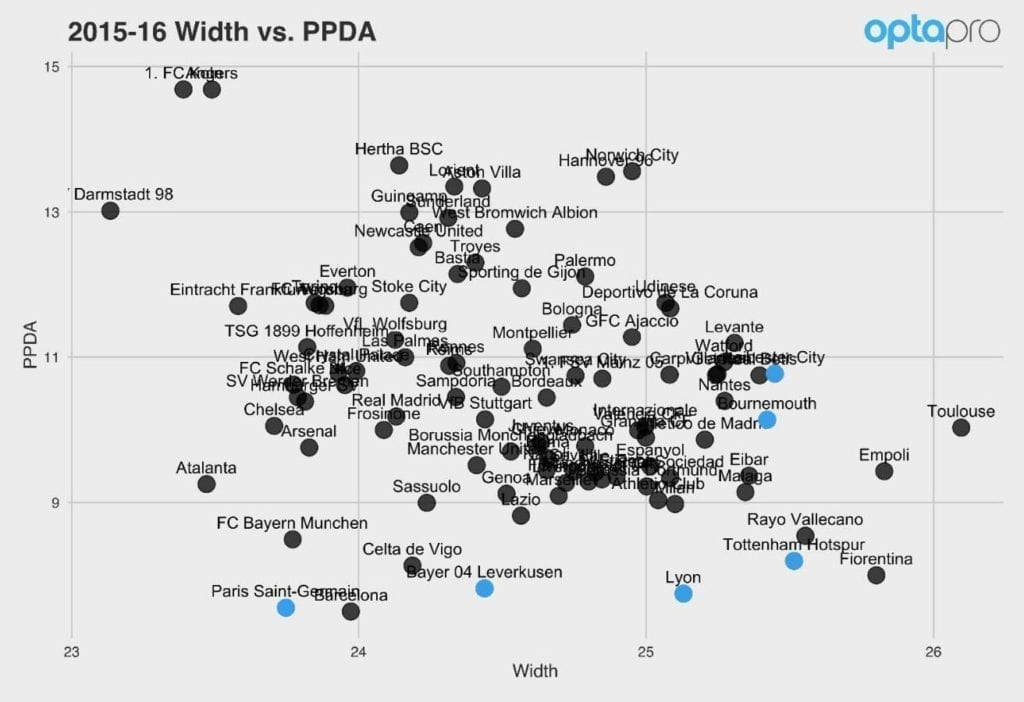
In particular, there are a few highlighted teams which are notable when viewed with width as an added dimension. Tottenham are towards the extreme in both width and PPDA, pushing opponents wide as well as engaging in a high number of defensive actions. However, Bayer Leverkusen, another team known for pressing high, don’t seem to push teams wide as a result. This measure for Leverkusen holds even amongst the more centrally-disposed Bundesliga, as they are near the middle of the pack by this metric amongst their domestic competitors.
Leicester City and Bournemouth profile interestingly in the Premier League, as neither seem exceptional in either extreme by PPDA, but both are amongst the top 10 in the entire sample in forcing opponents wide. Paris Saint-Germain and Lyon were the two Ligue 1 representatives amongst the top 10 in PPDA, but they represent opposing ends of the spectrum in terms of opponent action width.
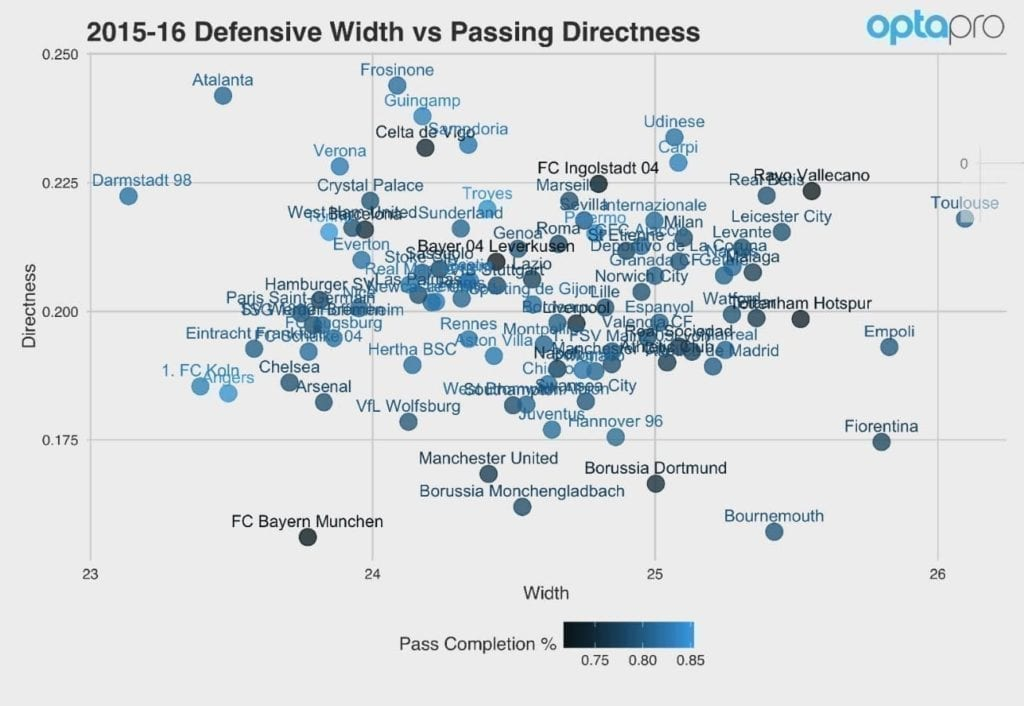
Viewing some of the other new measures together presents some interesting patterns. Below, width and directness are graphed against one another and compared to opponent pass completion percentage. Bournemouth’s defensive system is very interesting viewed on these axes. Though they stood out neither in terms of PPDA nor pass completion allowed, Bournemouth allowed the second least direct passing in the entire sample, trailing only Bayern Munich. Together with the width they force in their opponent’s actions, this paints a picture of a disciplined if conservative pressure whose goal is to systematically deny ball progression into advantageous positions rather than attempting to create turnovers which lead to attacking opportunities.
In addition to adding descriptive measures for new characteristics of pressure, looking at the original metrics of PPDA and pass completion percentage in a different way can reveal implications about efficiency.
Below, the relationship between PPDA and opponent pass completion percentage is shown. It appears that there’s a fairly strong positive correlation between the two across the sample of teams.
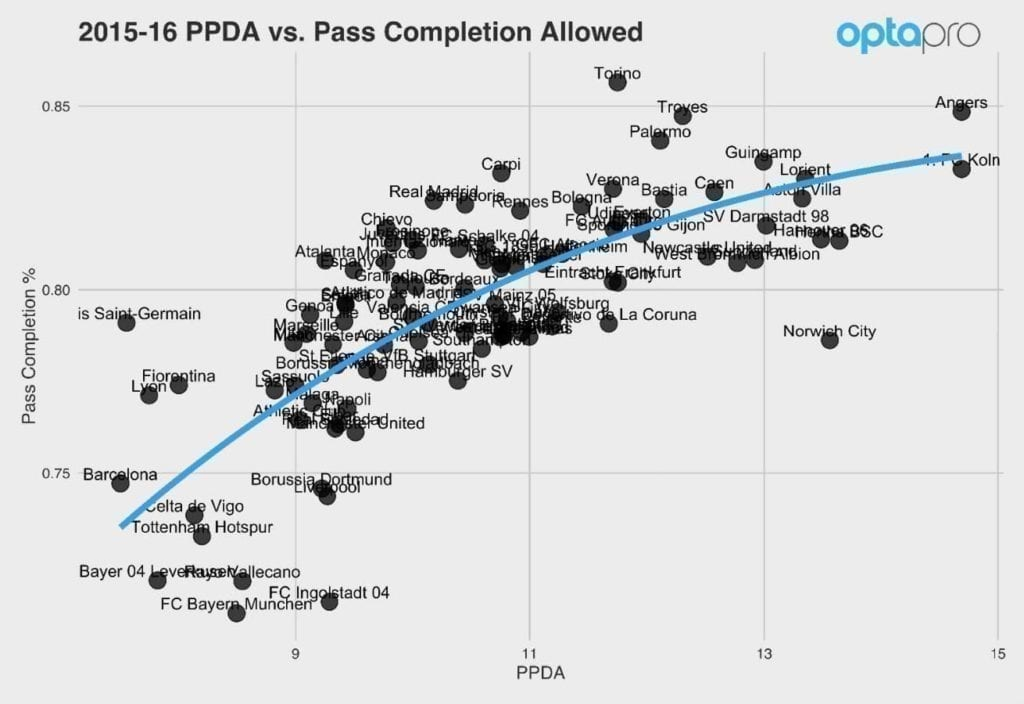
The line on this graphic represents a best fit estimate of the relationship between the two metrics.** By looking at how teams deviate from this relationship, we can see a team-by-team measure of opponent pass completion percentage relative to what would be expected from this model based on PPDA. The differences between actual pass completion percentage allowed and the estimated value highlights a team’s efficiency in disrupting opponent possession relative to the number of defensive actions. The deviations from the estimated relationship are displayed below along the y-axis, with opponent action width added.
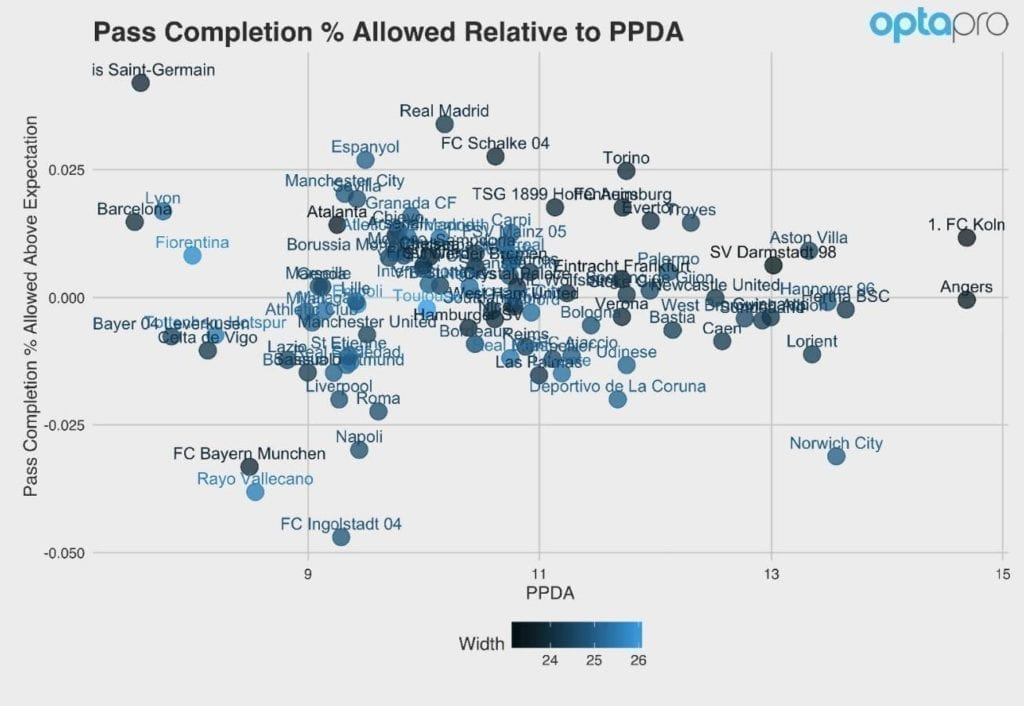
Here we can clearly see how PSG are extreme outliers in terms of how little their defensive actions translate into limiting opponent pass completion. FC Ingolstadt of the Bundesliga are the opposite to PSG, making passing extremely difficult for their opponents.
Width can be seen to cut two ways on this graph. In one sense, pushing opponents wide limits their ability to pass into dangerous positions. On the other hand, teams which commit to high defensive pressure as a tactic for generating their own attacking opportunities might benefit from turning the ball over closer to the middle of the pitch, where they’ll be closer to goal upon winning the ball back. Bayer Leverkusen, for instance, leverage their defensive efforts into incompletions similarly to Tottenham, but they force their opponents much more centrally, meaning the turnovers they do generate are in more advantageous positions. The flipside of this scenario is represented by teams like FC Schalke and Real Madrid, who not only allow high completion relative to expectation, they also do so while allowing the opponent to operate centrally.
While these additional metrics I’ve introduced in this blog are not necessarily better for measuring high defensive pressure than PPDA or pass completion and its derivatives, they do however measure unique and different aspects of this aspect of play, which adds important context to the existing measures. Being able to view a single concept from different angles in this way can be invaluable in a scenario where we’re trying to quantify something using event-based metrics which involves team-wide coordination and depends on off-ball movement.
*This measure is equal to the sine function of the pass angle from the horizontal and thus passes which travel backward have negative values, a pass straight ahead has a value of 1 and a pass straight backwards has a value of -1
**The line on the graph actually represents the average relationship across all competitions, where in the model I built, I estimated a slightly different line for each competition. This is the model used to generate the values for the residual plot.