Introducing Expected Goals on Target (xGOT)

Key takeaways
– xG is a pre-shot model, whereas xGOT is a post-shot model.
– At shooter level, we can better understand if goalscoring has been down to good finishing over a sustained period or as a result poor goalkeeping.
– Goalkeeper performance can be better understood when comparing goals to xGOT faced.
Following on from our Expected Goals (xG) model, we have developed a separate model for Expected Goals on Target (xGOT). This model builds upon the original xG model by crediting on-target shots based on a combination of their underlying chance quality (xG) and the quality of their execution.
xG measures the quality of the chances that a side makes and xGOT builds on this to tells us what a team managed to do with these chances. Essentially, xG is a pre-shot model while xGOT is a post-shot model.
The Expected Goals on Target model is built on historical on-target shots and includes the original xG of the shot but also the goalmouth location where the shot ended up. It gives more credit to shots that end up in the corners compared with shots that go straight down the middle of the goal. This model is only for on-target shots given that if you don’t get your shot on target, there’s a 0% chance that it will result in a goal.
Let’s look at an example. Below we can see Daniel Sturridge’s late equaliser for Liverpool against his former club Chelsea, early in the 2018/19 Premier League season.
Sturridge’s shot was assigned an xG value of 0.03. Given that his shot was taken from more than 27 metres out, the pre-shot chance quality measure is relatively low here. However, in our post-shot xGOT model, we will also account for the finishing location of his shot in the goal.
In the graphic below, we can see the goalmouth location for this shot:
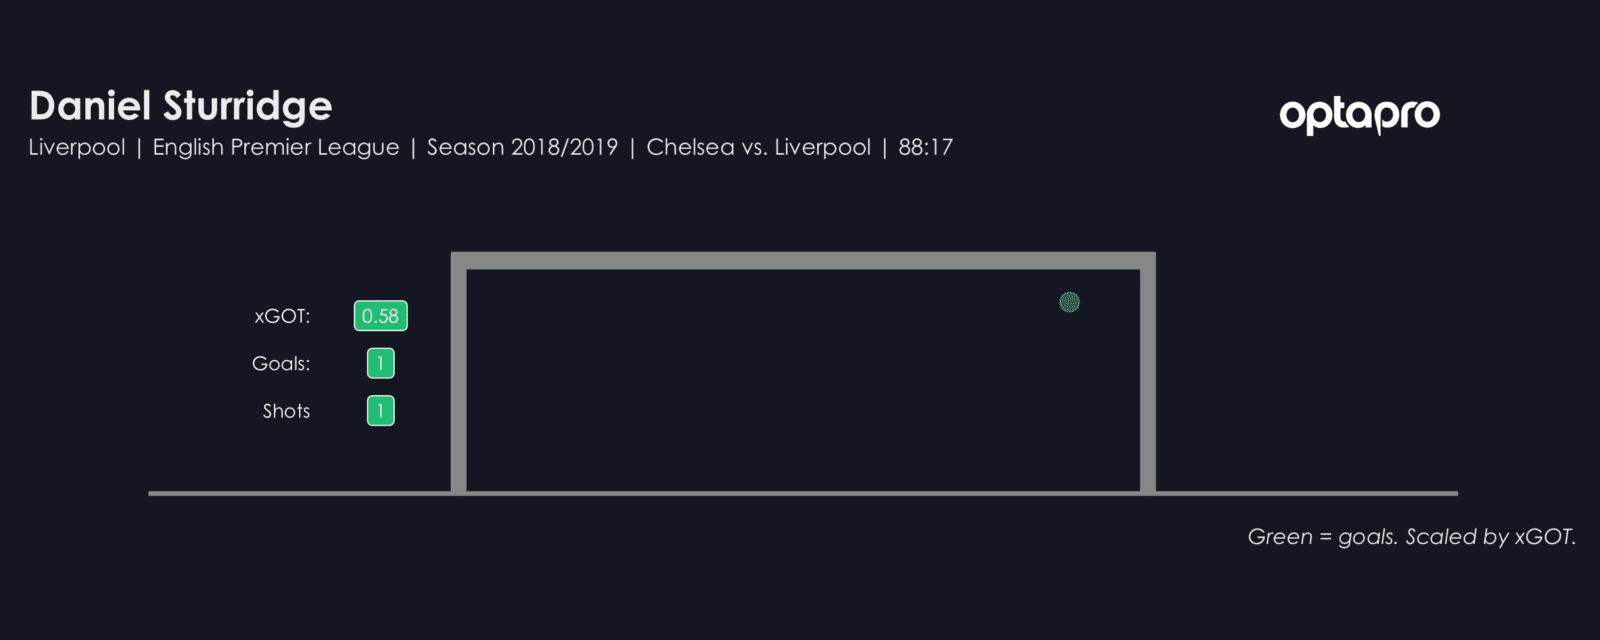
Sturridge’s shot went into the top right corner of the goal, making it incredibly hard to save. Consequently, despite the difficulty of the chance, the high quality of Sturridge’s shot is reflected in the post-shot xGOT model and his shot is assigned an xGOT value of 0.58.
Quantifying finishing ability
We can use these xGOT values as an indicator, over a given time period, for how well a player is shooting. For example, a player whose xGOT is exceeding their xG is executing better quality shots, given the quality of chances he has attempted shots from. We call this difference between xGOT and xG, Shooting Goals Added (or SGA).
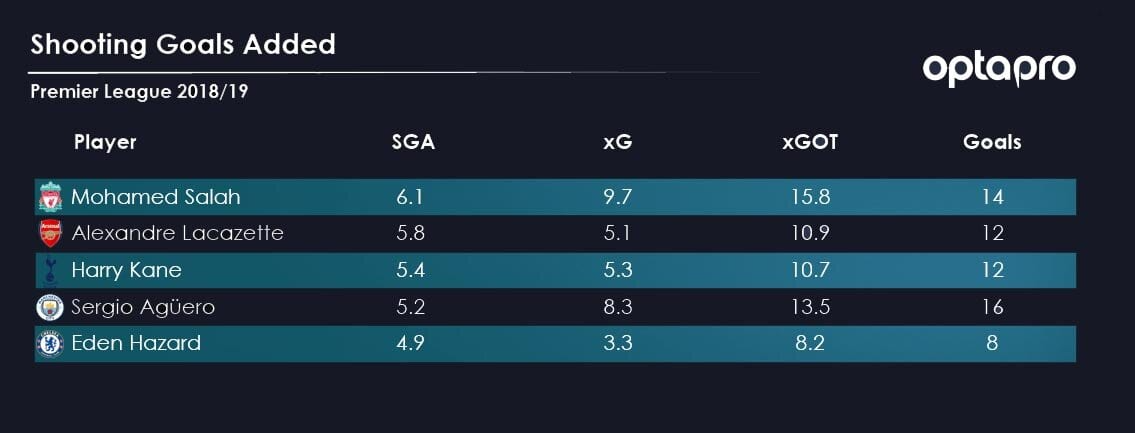
*Excluding penalties and blocked shots
In the table above, we can see the top 5 Premier League players this season in terms of SGA. Perhaps one of the most notable names on the list is Eden Hazard, who has scored 8 goals for Chelsea so far this season with a comparatively low xG of 3.3. You can clearly see that he is outperforming the quality of his chances. With an xGOT value of 8.2, we can now credit this difference to the quality of his finishing.
This impressive shooting so far this season has improved the quality of Hazard’s pre-shot chances by 4.9 goals. This indicates that, from his given chances, he is both getting his shots on target and hitting them in good locations.
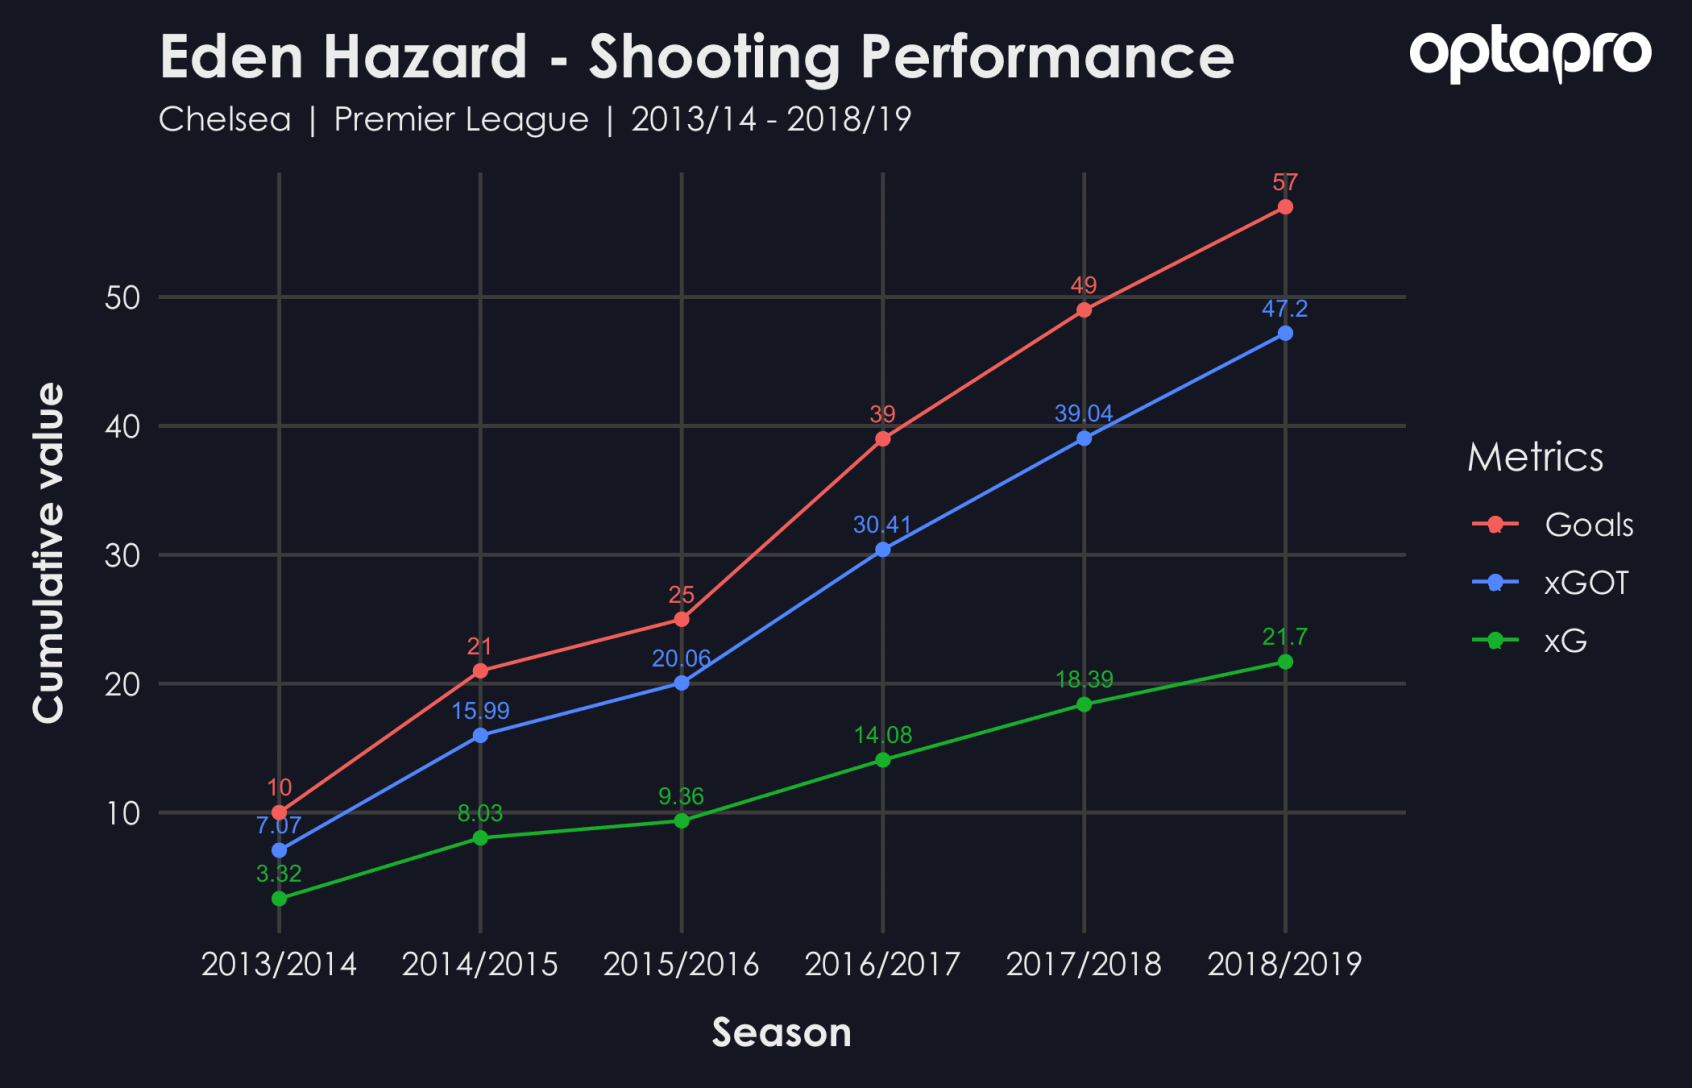
In fact, by analysing Eden Hazard’s cumulative xG and xGOT values in the graph below, we can see that Hazard’s remarkable shooting ability has seen him consistently outperform the underlying quality of his given chances in each of the last six Premier League seasons.
Measuring goalkeeper performance
Another use of xGOT is as a tool for analysing goalkeeper performances. We can use it to highlight the goalkeepers who have under-conceded considering the quality of the shots on target they’ve faced. This can be seen by calculating the number of goals prevented(calculated as xGOT conceded from shots on target faced, minus goals conceded).
This metric allows us to distinguish between the goalkeepers who are making high quality saves and those whose save counts may have been inflated by easy, low quality shots.
Let’s compare David De Gea’s Premier League golden glove winning season in 2017/18 with his performances so far in the league this season:
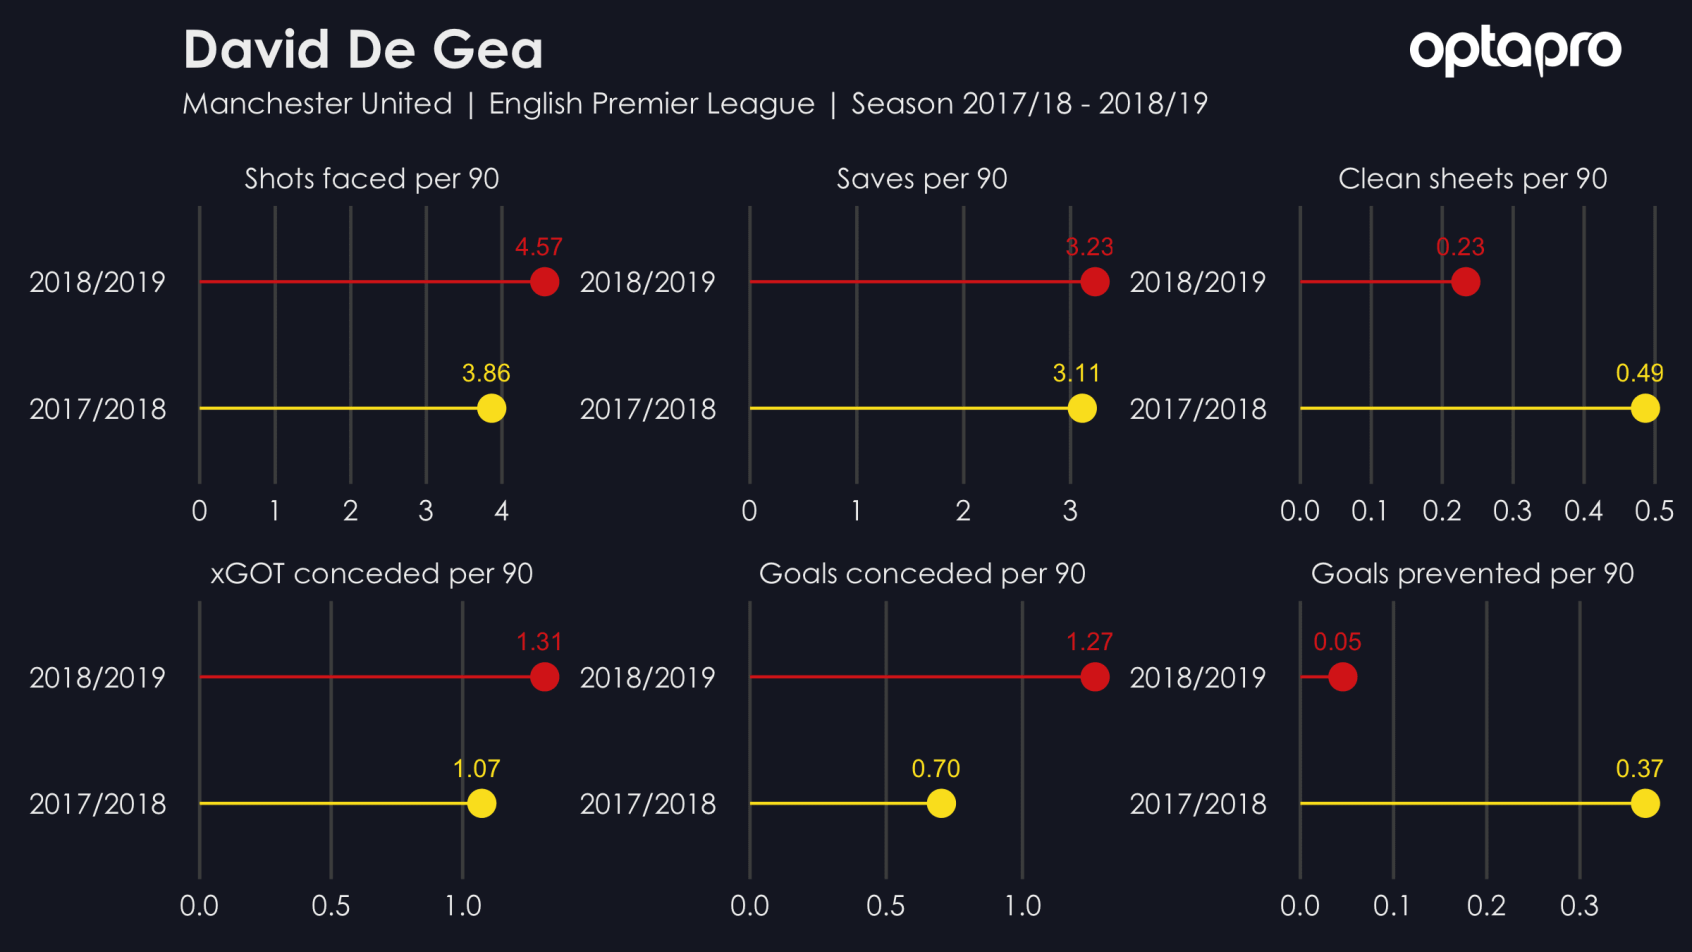
De Gea kept a remarkable 18 clean sheets last season, the most in the Premier League since 2012/13. He conceded 28 goals, but the quality of the on-target shots he faced, according to xGOT, was enough to concede nearly 40 goals (39.7). De Gea, therefore, was responsible for his side conceding nearly 12 fewer goals than the average ‘keeper would have, at a rate of nearly one every three games.
This season has been a different story. De Gea has conceded 12 more goals than he did last season and he has achieved this unfortunate feat with 8 league games remaining. You may say that Manchester United’s defenders haven’t helped him out, with De Gea facing 4.6 shots per 90 minutes compared with 3.9 last season.
However, despite matching this with an increase in saves per 90 minutes, it was only after improved performances under new manager, Ole Gunnar Solskjaer, that De Gea has actually been attributed with a positive goals prevented value over 2018/19. De Gea has now conceded 38 goals while, according to xGOT, the quality of the on-target shots he faced suggested he should have conceded just over 39 goals.
Although this isn’t particularly a cause for concern, unfortunately for Manchester United it appears that De Gea hasn’t sustained his superhuman form from 2017/18 and has regressed to normality.
We can see a graphical representation of De Gea’s performances, using xGOT, over the last six Premier League seasons below:
While De Gea has over-performed in a few campaigns (with a positive goals prevented per 90 minutes played) he has tended to regress back towards zero in the subsequent season. So it appears that it may be difficult for a goalkeeper to maintain over-performance over a long period of time.
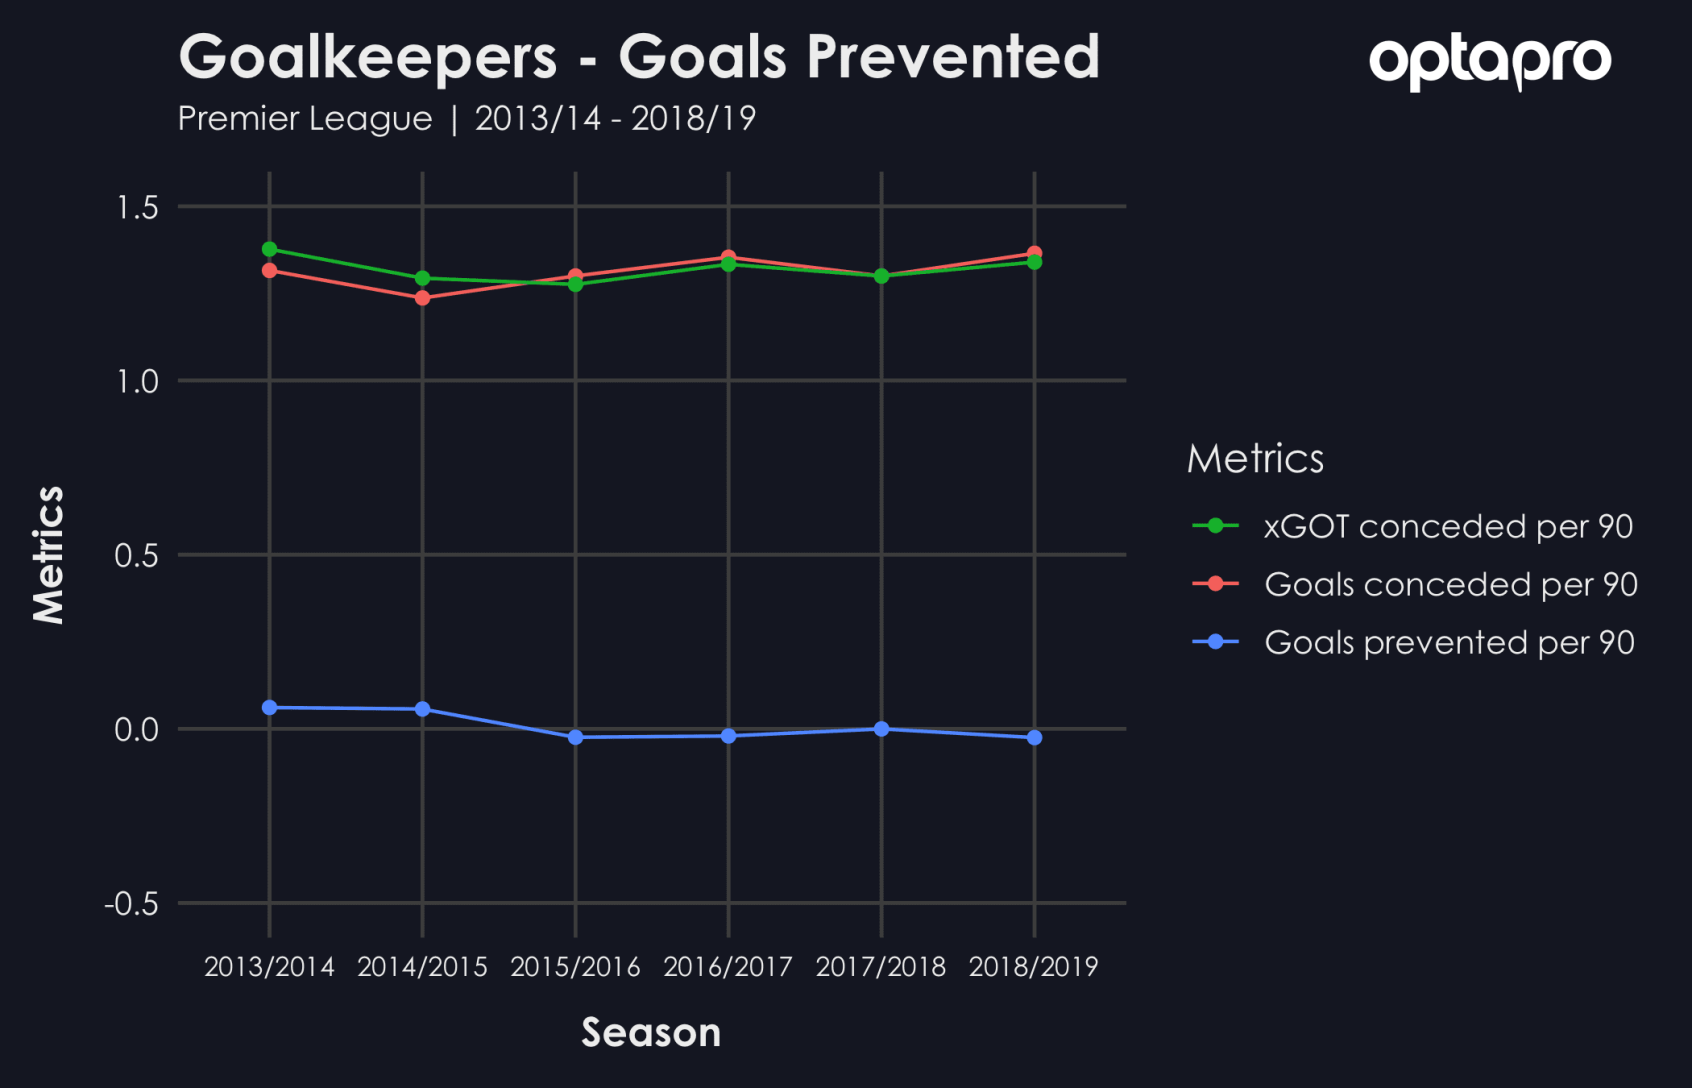
This is evidenced when we look at the graph for the combined performances of all Premier League goalkeepers over the same time period below. We can see that they consistently conceded in line with what they were expected to concede, given the quality of the shots on target they faced. Over these six seasons, they were, according to xGOT, expected to concede 5807 goals and conceded only 40 less than this in reality.
Using xGOT in this way allows us to give specific credit to goalkeepers for their performances, whereas more traditional measures such as clean sheets may be biased by team form or defensive strengths.